CYTOSCAPE
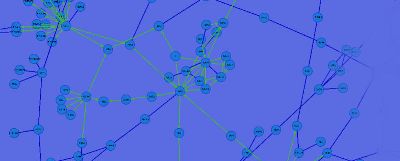
Cytoscape is an open source bioinformatics software platform for visualizing molecular interaction networks and integrating these interactions with gene expression profiles and other state data.

PATHBLAST WEBSITE
Pathway alignment and query againt protein interaction databases to identify conserved protein interaction networks between species. PathBLAST searches the protein-protein interaction network of the target organism to extract all protein interaction pathways that align with a pathway query.

NETWORKBLAST SOFTWARE
NetworkBlast analyzes protein interaction networks in order to predict previously unknown relationships. It can compare multiple species' protein interaction networks and infer interactions through homology. The program is best used in conjunction with Cytoscape to easily visualize the returned data.

VERA and SAM
VERA and SAM was developed to address the need for a better statistical test for identifying differentially-expressed genes. VERA estimates the parameters of a statistical model that describes multiplicative and additive errors influencing an array experiment, using the method of maximum likelihood. SAM gives a value, lambda, for each gene on an array, which describes how likely it is that the gene is expressed differently between the two cell populations.

DAPPLE
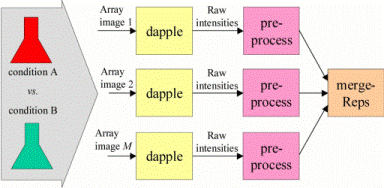
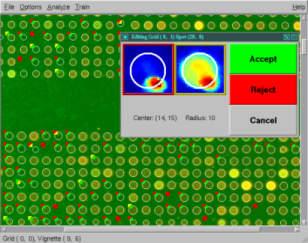
Dapple is a program for quantitating spots on a two-color DNA microarray image. Given a pair of images from a comparative hybridization, Dapple finds the individual spots on the image, evaluates their qualities, and quantifies their total fluorescent intensities. Dapple is designed to work with microarrays on glass.

CRAZYQUANT
CrazyQuant is a spot-finding tool developed by Trey Ideker while at the University of Washington (cited in O'Reilly's Beginning Perl for Bioinformatics). This JAVA-based applet allows the loading and quantitation of your cDNA microarray images and membranes.

enoLOGOS
Program enoLOGOS generates LOGOs of transcription factor DNA binding sites from various types of input matrices. It can utilize standard count matrices, probability matrices or matrices of "energy" values (i.e., log-frequencies).

|


